On the Statistics page, select your license type and data source, and set a date range.
If you need help selecting your license type, data source, and date range, please see our account statistics guide.
- After setting your license type, data source, and date range set, select your license type, data source, and date range set, select the Similarity Report tab.

- Once you select the Similarity Report tab, the Similarity Report chart will appear. This chart is a visual representation of similarity ranges found for documents submitted to the account during the specified dates.
-
To view the number of your organization's Turnitin submissions that fell within similarity score range on a certain day, hover and move your mouse over the data line. Pop-ups will appear listing the submission numbers for each score range that correlate to the dates listed along the bottom of the chart.
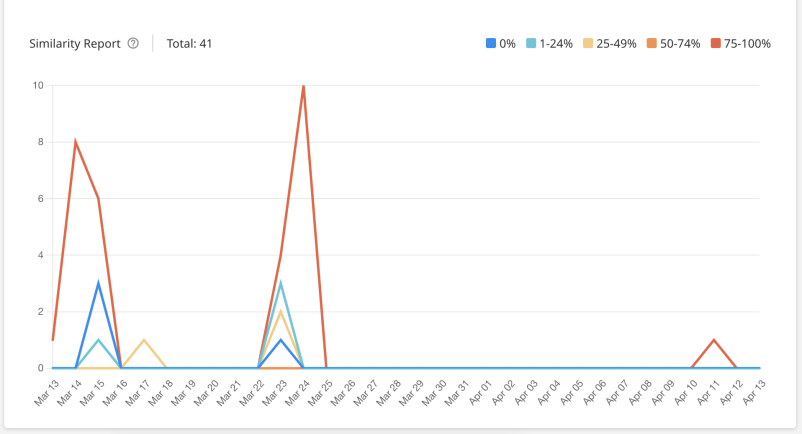
Light blue: 0% matching text Dark blue: 1-24% matching text Yellow: 25-49% matching text Orange: 50-74% matching text Red: 75-100% matching text